Cryptos That Hit All-Time Highs Today

Despite a slight downturn in the broader cryptocurrency market, several altcoins have bucked the trend, hitting new all-time highs today.
BeInCrypto has analyzed three standout tokens, with Fartcoin (FARTCOIN) leading the charge.
Fartcoin (FARTCOIN)
Meme coin FARTCOIN surged to a new all-time high of $0.73 during the early Asian session on Friday. It is now trading at $0.63, reflecting a 12% decline from its peak.
Today’s all-time high is the sixth in seven days, reflecting the steady uptick in the altcoin’s demand, mostly fueled by meme coin mania. The setup of FARTCOIN’s Moving Average Convergence Divergence (MACD) confirms this bullish outlook.
At press time, its MACD line (blue) lies above its signal line (orange). When this momentum indicator is set up this way, it suggests a bullish trend. It indicates that the asset’s price may continue to rise. This crossover is often seen as a signal to buy, reflecting increased buying pressure.
If this trend persists, FARTCOIN’s price will reclaim its all-time high and rally past it. On the other hand, the meme coin’s price may drop to $0.56 if selling pressure spikes.
Fasttoken (FTN)
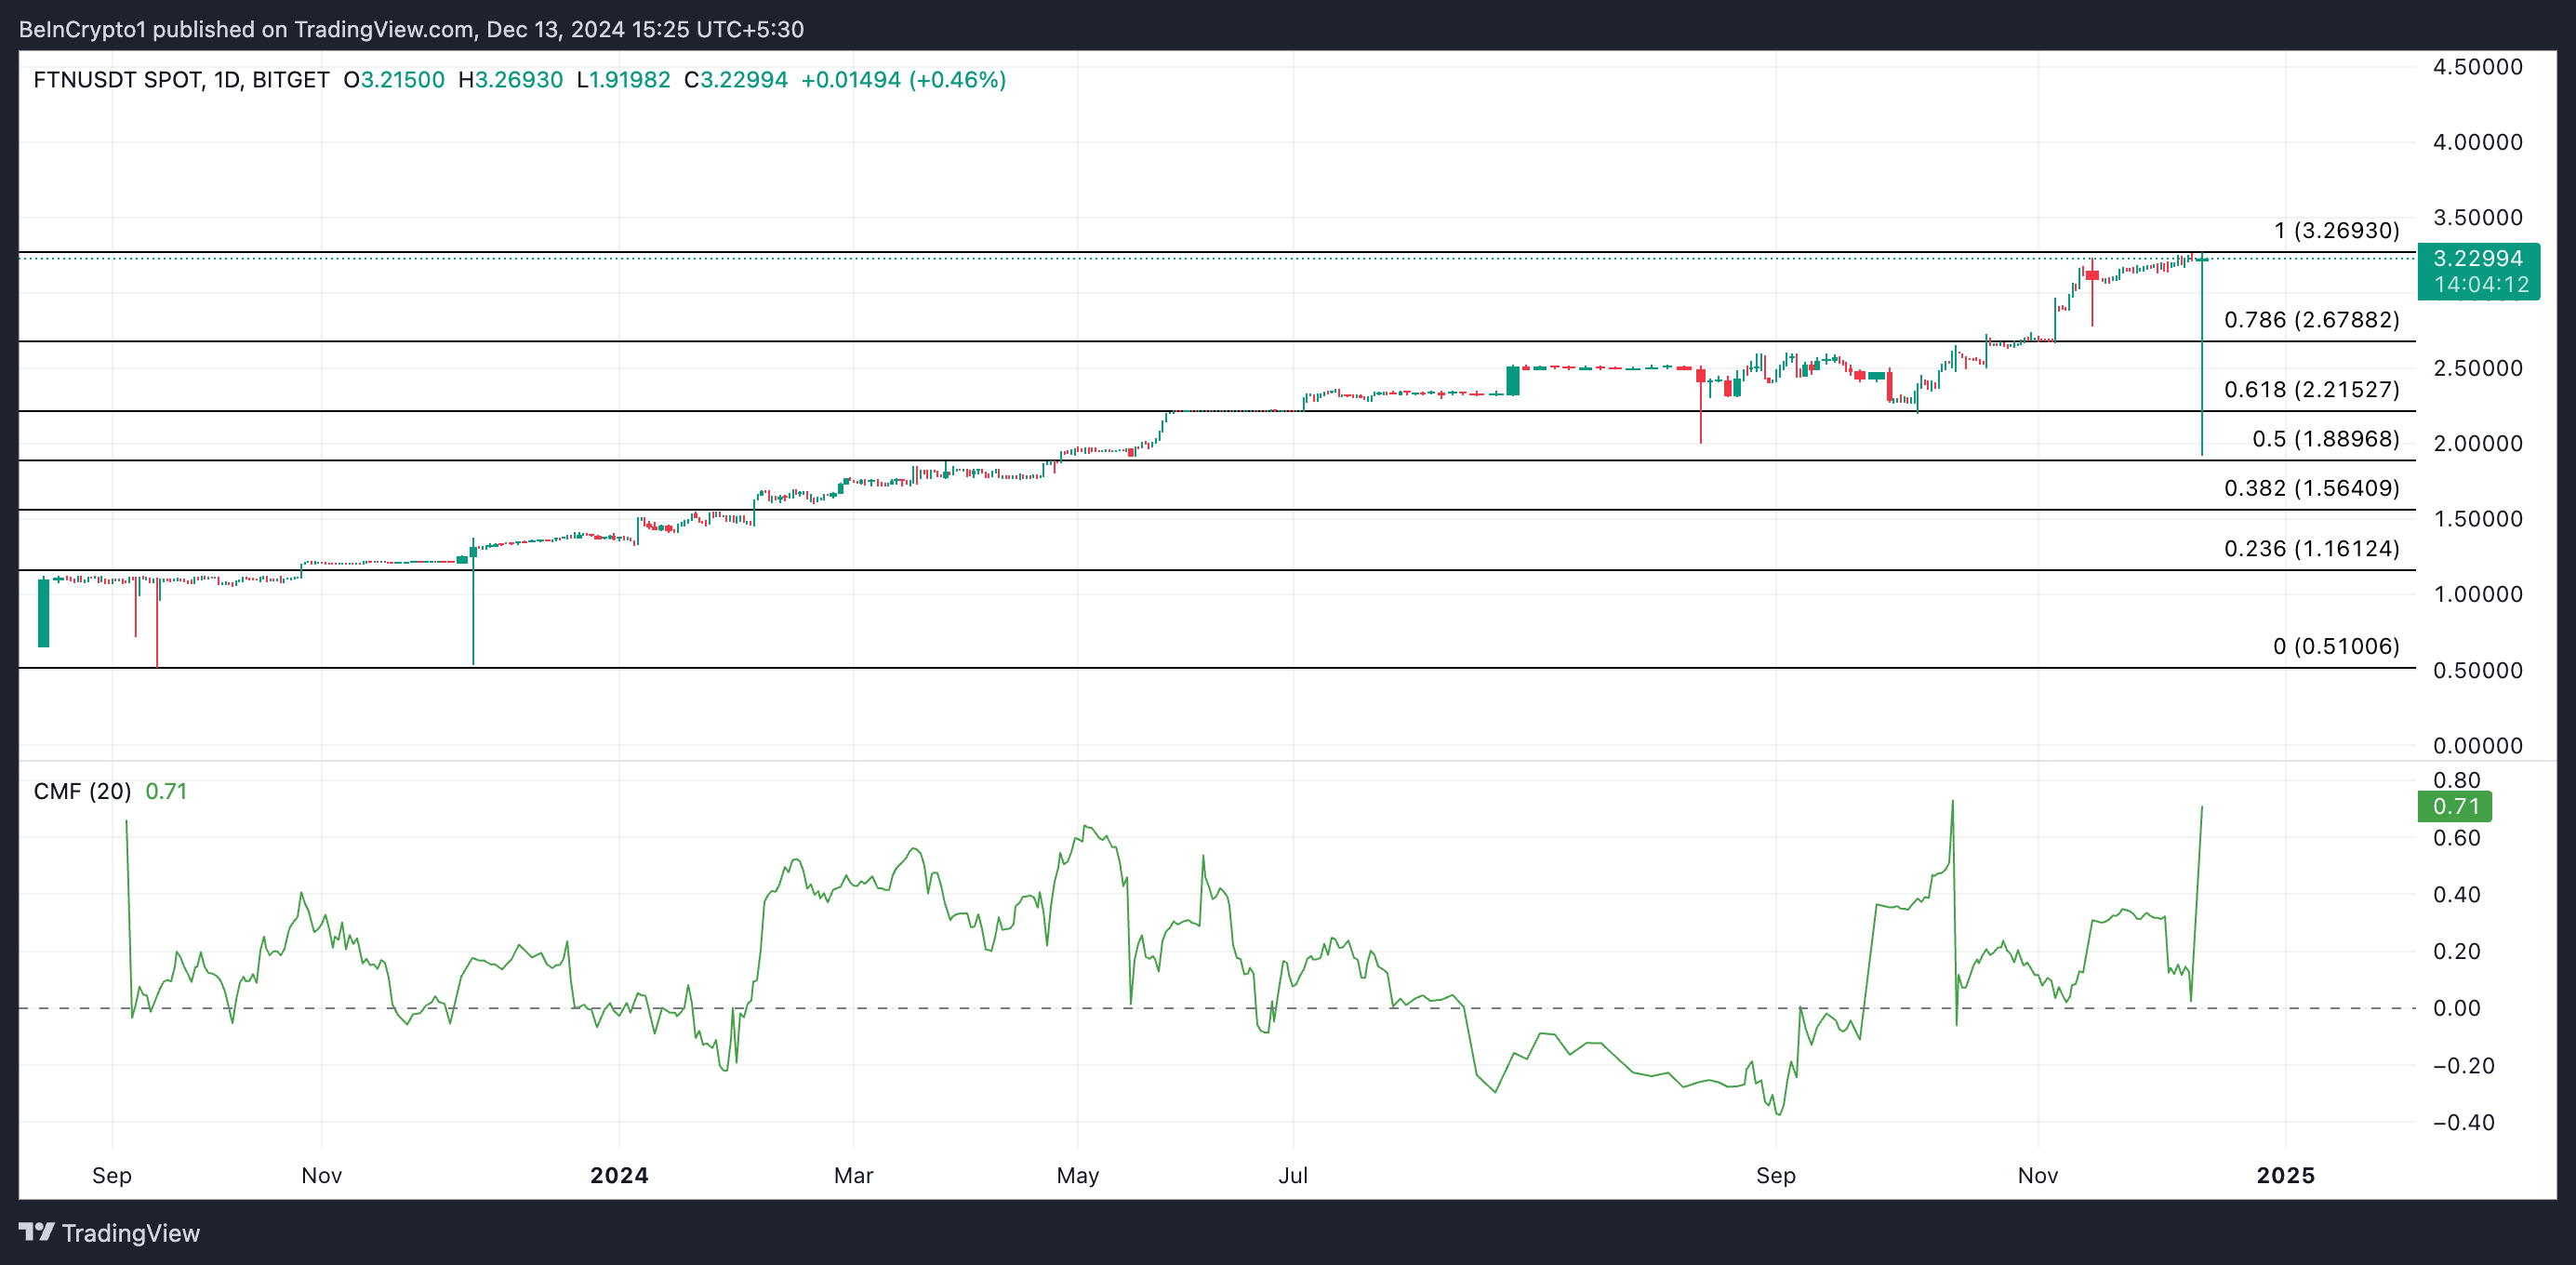
Fasttoken (FTN) is the native cryptocurrency of the layer-1 blockchain platform Bahamut. It rose to an all-time high of $3.26 today. While its price has since dropped by 1%, the token continues to enjoy a significant bullish bias.
This is confirmed by its rising Chaikin Money Flow (CMF). As of this writing, FTN’s CMF is at 0.71.
The CMF indicator measures the accumulation and distribution of an asset over a specified period, typically 21 days. When the CMF is above zero, the asset is experiencing more buying pressure than selling pressure, suggesting a bullish trend. This positive reading often signals a potential upward price movement.

If the rally persists, FTN will reclaim its all-time high of $3.26, possibly flip it into a support floor and rise further. Conversely, if profit-taking activity spikes, the altcoin’s value will plummet to $2.67.
Gigachad (GIGA)
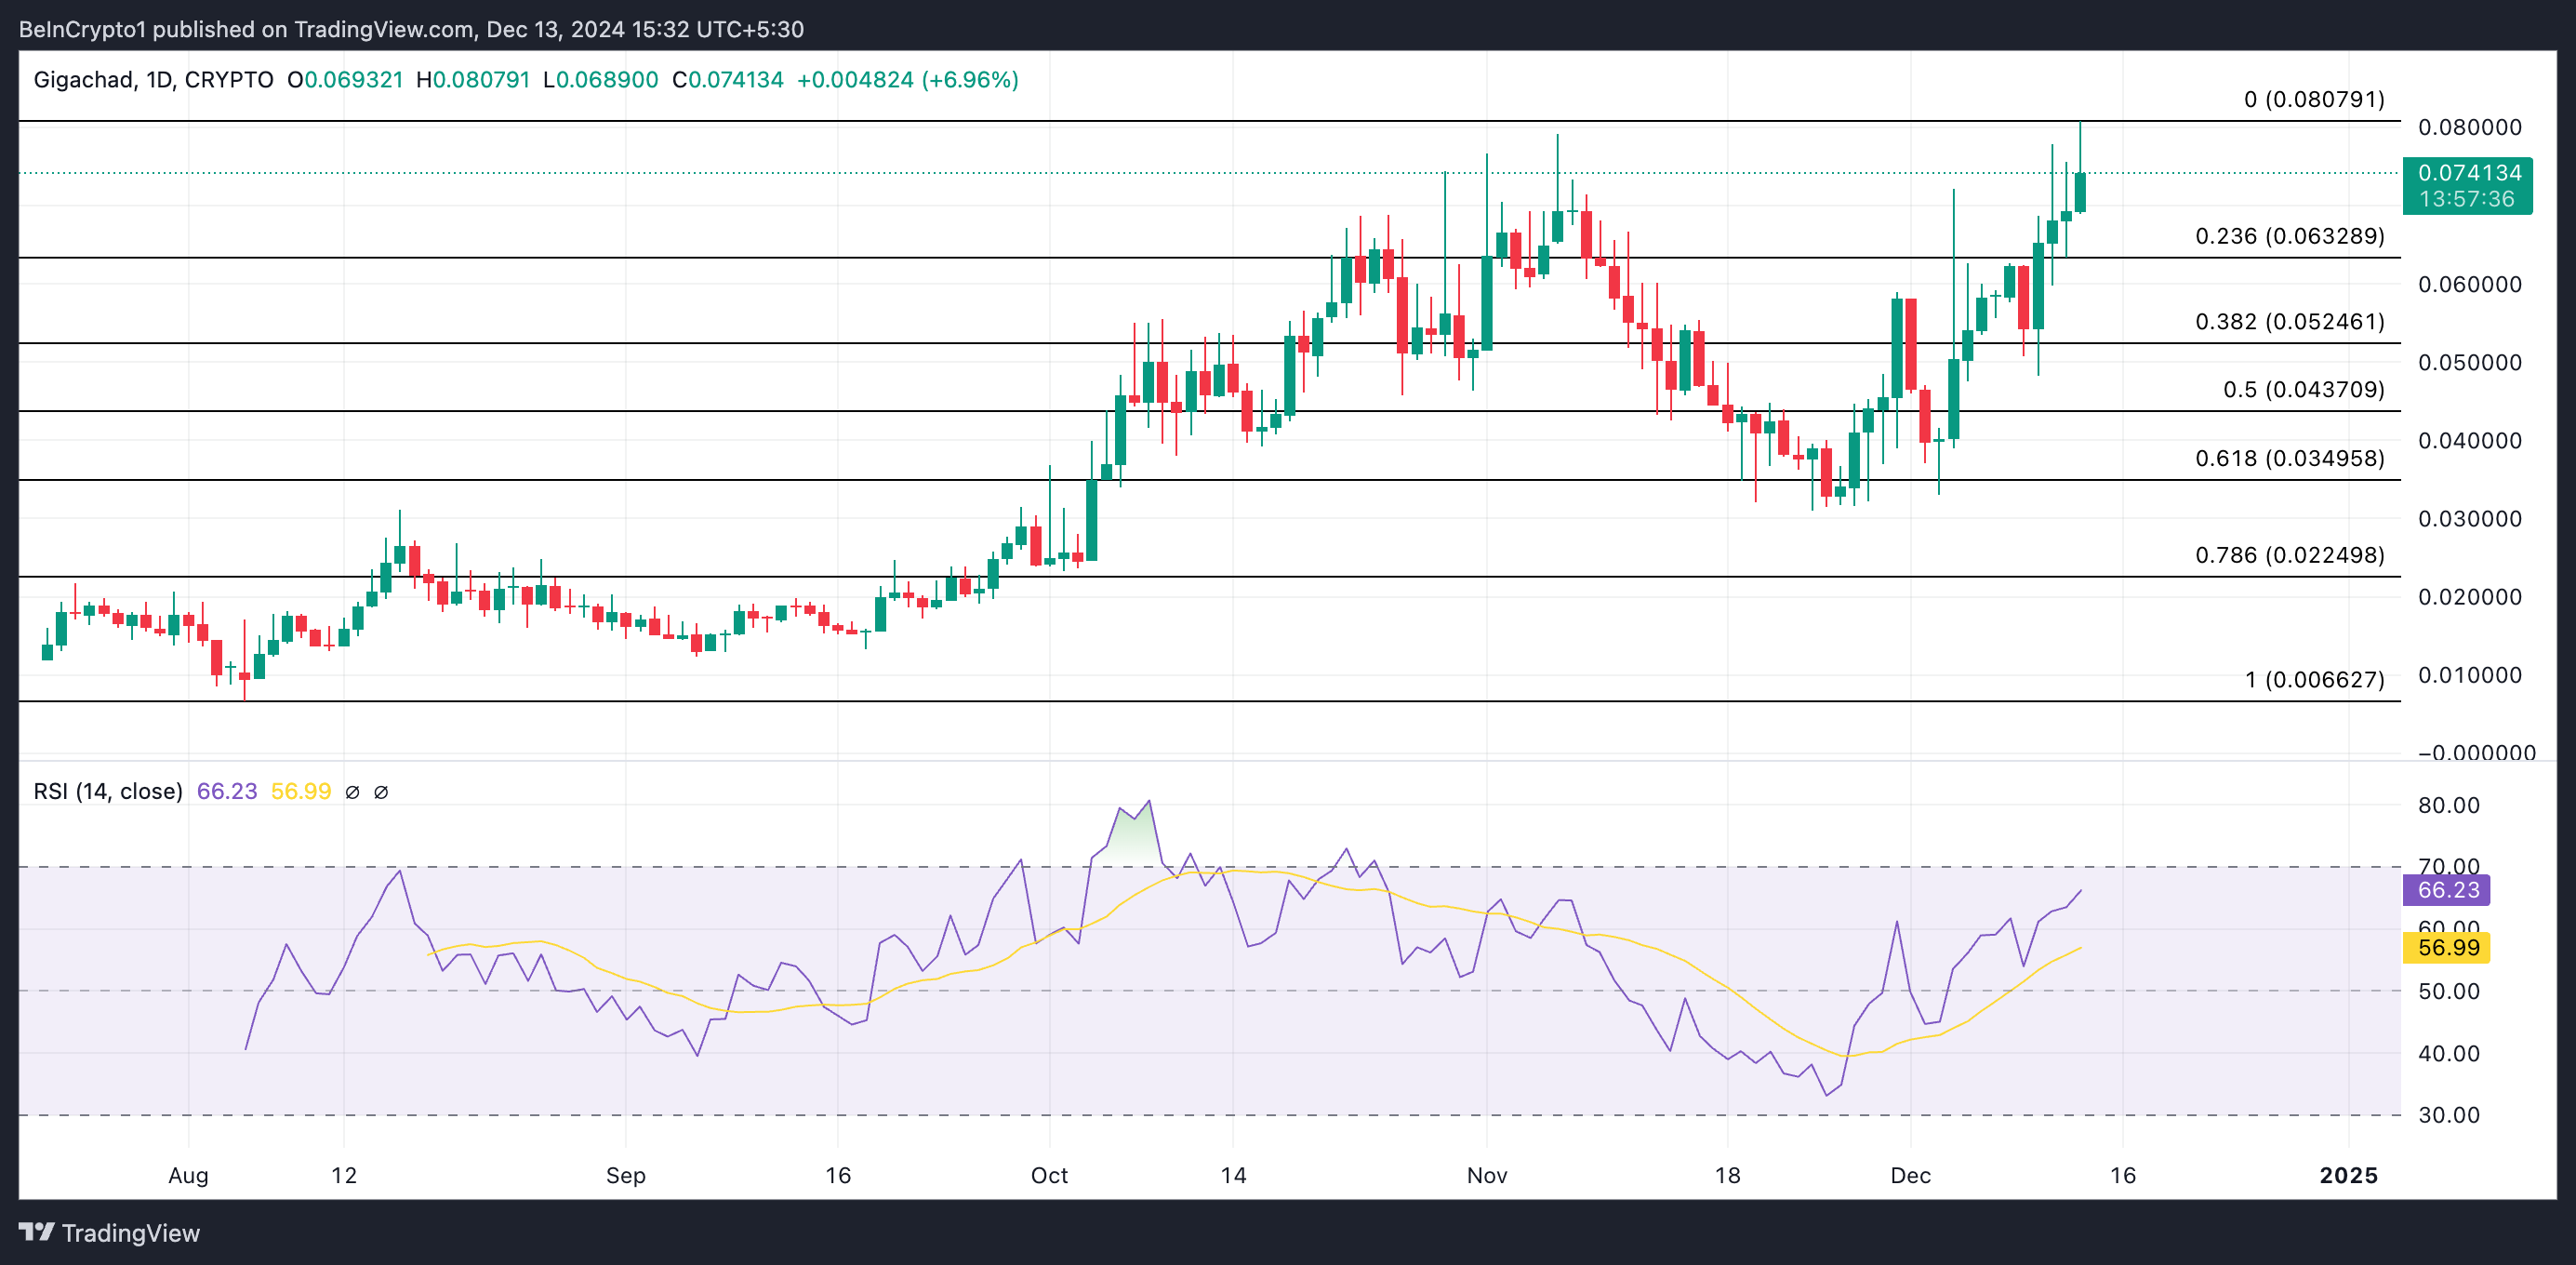
Solana-based meme coin GIGA hit an all-time high of $0.080 earlier today. It has since witnessed an 8% pullback causing it to trade at $0.074 at press time.
Nevertheless, token accumulation persists among market participants, as reflected by GIGA’s rising Relative Strength Index (RSI). At the time of writing, this is at 66.23.
An asset’s RSI indicator measures its overbought and oversold conditions. Its values range between 0 and 100, with values above 70 indicating that the asset is overbought and due for a correction. On the other hand, values under 30 suggest that the asset is oversold and may witness a rebound.

GIGA’s Relative Strength Index (RSI) of 66.23 indicates that the asset is nearing overbought conditions. While bullish momentum remains strong, higher RSI levels could signal a potential reversal or consolidation. In the event of a pullback, the meme coin’s value might decline to $0.063.
Disclaimer
In line with the Trust Project guidelines, this price analysis article is for informational purposes only and should not be considered financial or investment advice. BeInCrypto is committed to accurate, unbiased reporting, but market conditions are subject to change without notice. Always conduct your own research and consult with a professional before making any financial decisions. Please note that our Terms and Conditions, Privacy Policy, and Disclaimers have been updated.


